New Madrid Seismic Zone graphics, illustrations, diagrams

Natural gas pipelines & NMSZ

Map pages 1 | 2 | 3 | 4 | 5 | 6 | aerials

This company (above) delivers Billions of cubic feet of gas per year through 19 major pipelines. Note how the pipelines cross the New Madrid Seismic Zone. Click map to their website.

"You have four of the five major natural-gas pipelines come right through the soup in New Madrid, the soft alluvial soil," says Gray. "They carry gas all the way to Detroit, Chicago, Indianapolis and Pittsburgh. If (the earthquake) happened during the winter, you're going to have major-league problems on your hands. Try to explain to somebody why you cannot heat a nursing home or keep a hospital warm."
-- Ed Gray, Missouri State Emergency Management Agency (SEMA)
Riverfront Times

An earthquake in the middle of the country, along the precarious New Madrid fault, could have enormous fiscal and energy consequences. "Virtually every natural gas pipeline in the nation is built over that fault," Geller says. "You'll see the explosion reflected off the moon."
--insurancenewsnet.com


Oil Gas pipeline map US
The main production areas and pipeline routes for natural gas (American Gas Association)


The graphics immediately above and below are from a Feb 09 PDF (3 meg) from Argonne Labs. Note from above... TEN pipelines. From below: several high voltage towers and transmission lines. Widespread multiple failures would take longer to repair.


above: typical pumping station along a gas pipeline.
below: Texas Eastern pipeline crosses Mississippi river at Grand Tower IL

pipelines new madrid area map

U.S. Natural Gas Pipeline Network, 2009 map


 Meeman/Shelby / Porter's Gap Fault in West Tennessee

We may hear more about it, or others like it. - says geologist Roy Van Arsdale..

It runs along the bluffs just NW of Memphis. Has been dormant. Could devastate Memphis if it cut loose.


Most SBC/AT&T phone office switching buildings in Missouri's Bootheel were retrofitted in the 1990s to withstand a good shake. Pictured is in Charleston. Click pic for more.

Commerce Lineament map New Madrid http://erp-web.er.usgs.gov/reports/abstract/2003/cu/03hqgr0023.pdf


50-60ka means 50,000 to 60,000 years ago. Holocene means last 10,000
from USGS poster
A magnitude 4+ quake southeast of Cairo near Bardwell KY in 2003. USGS map from a PDF poster shows entire New Madrid region (above).

Wide map of New Madrid Seismic Zone

2003: Kentucky Emergency officials see the hazard as less serious PDF

Seth Stein of Northwestern University sees threat as less serious

   "NEW MADRID really scares me," said Jim Wilkinson, director of the Memphis- Central United States Earthquake Consortium, ( cusec.org ) an eight-state emergency preparedness group. "If New Madrid goes on the scale that we think it will ... we are going to impede the entire country.

   "All of the commerce, all of the oil and gas pipelines, everything comes right the central U.S.," Wilkinson said. "You drop the bridges across the Mississippi and Missouri rivers and the river locks and you've frozen this country." But Ky State Geologist Jim Cobb disagreed with the level of risk.


Mercalli scale by counties New Madrid Fault - from MO DNR

big new madrid quake locations of 1811-12
Main New Madrid quakes of 1811-12

sandblow locations
New Madrid area sandblows

mafic areas
New Madrid area showing mafic intrusions, plutons (iron type material that came up from earth's liquid core through cracks caused by ancient continents moving, faulting, earthquakes). Earthquakes tend to be near / between plutons. Illustrations above are from nrc.gov


structural features
Seismic Zones near, north, east of New Madrid area

new madrid fault segment diagramsFault Segmentation and possible rupture scenarios, New Madrid Fault


BA Blytheville Arch
BFZ Blytheville Fault Zone
BL Bootheel Lineament (now designated as fault)
NN New Madrid North
RF Reelfoot Fault
NW New Madrid West (Not shown here, see below)
RS Reelfoot South (Not shown here, see below)
  -- NW and RS are defined solely from seismicity

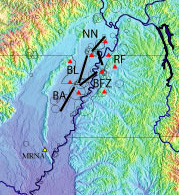
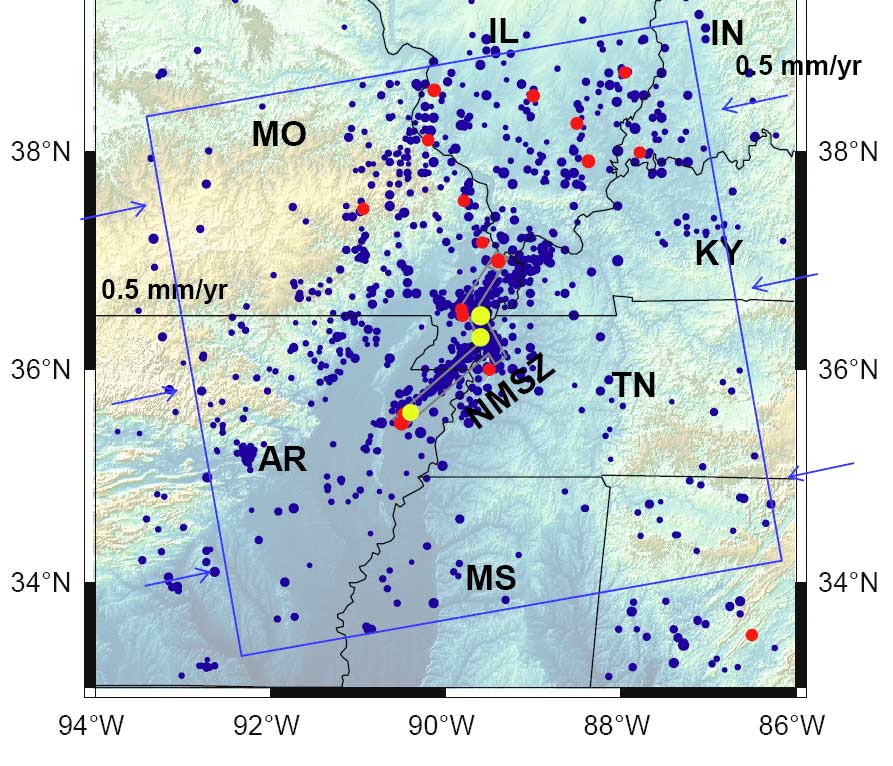
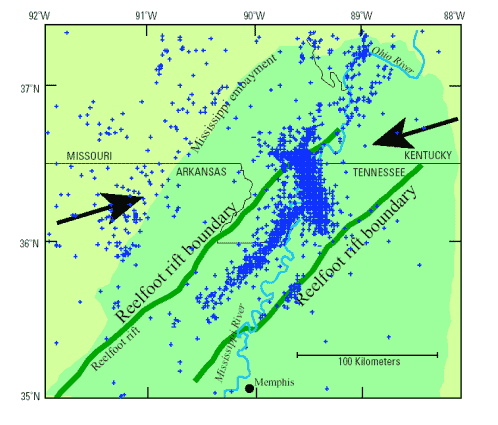
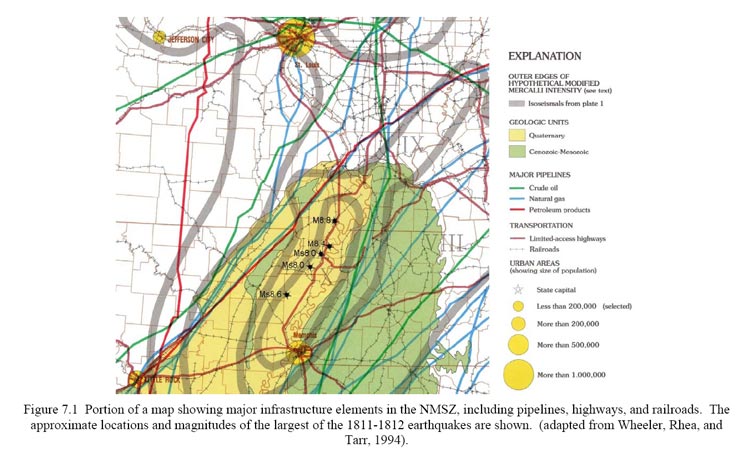
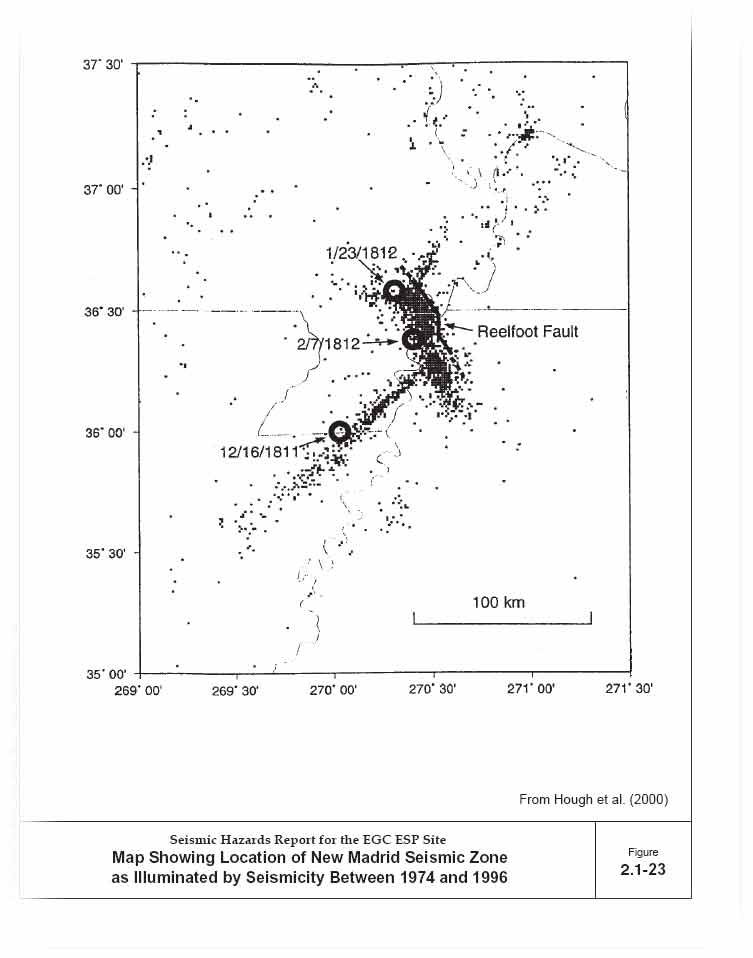
In recent years, numerous minor earthquakes or "microearthquakes" have revealed the presence of three deep subsurface faults in the New Madrid area. Two of the faults are southwest-northeast trending right-lateral strike-slips.

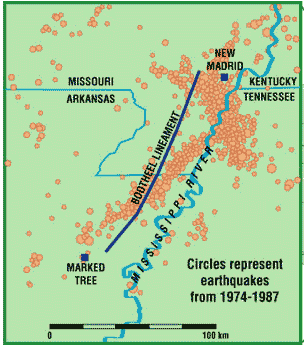
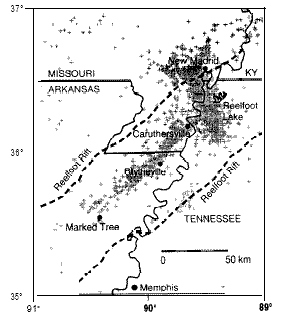
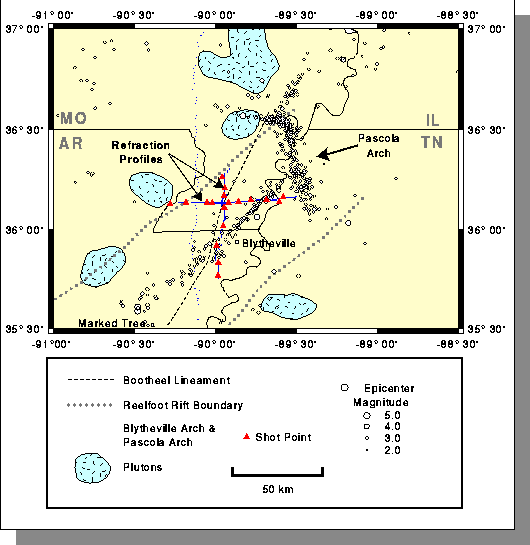
The southernmost strike-slip is called the Blytheville seismic zone and runs at least 70 miles from Arkansas through Missouri and into Tennessee. The other strike-slip fault is called the New Madrid north zone.

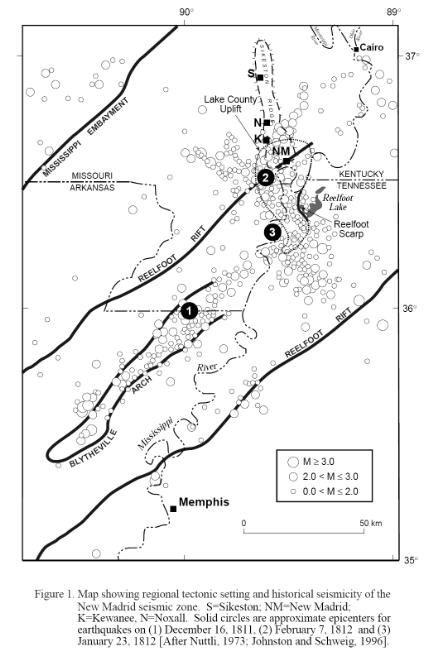
The third fault or Reelfoot fault, is a southeast-northwest trending reverse fault, which is located between the two strike-slip faults. On the reverse fault, the rocks on the southwest side move up relative to the rocks on the northeast side.

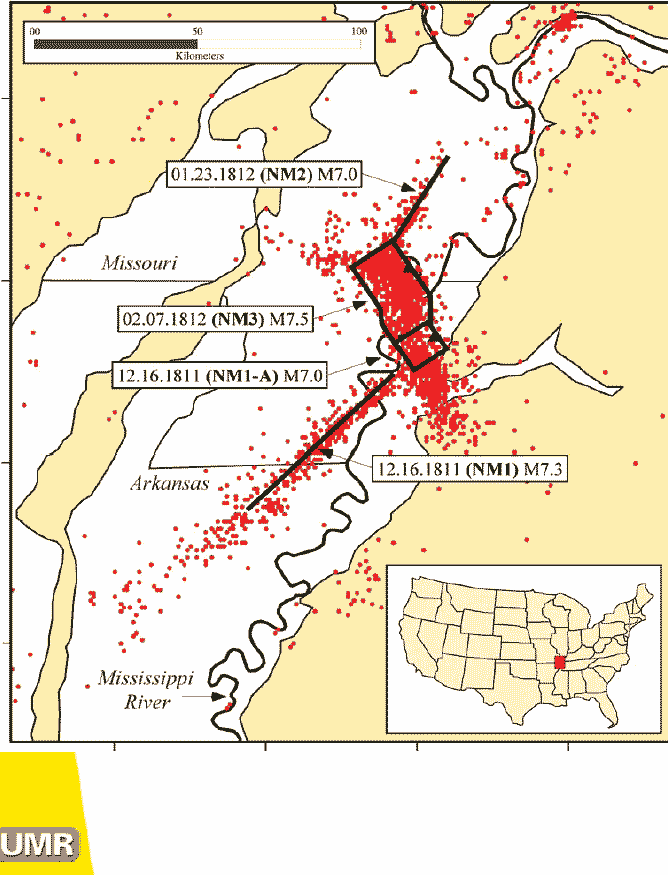
The main shock on December 16, 1811 may have been associated with activity on the southernmost strike-slip fault or the Blytheville seismic zone. The January 23, 1812 quake may have originated from the strike slip fault in the New Madrid north zone.

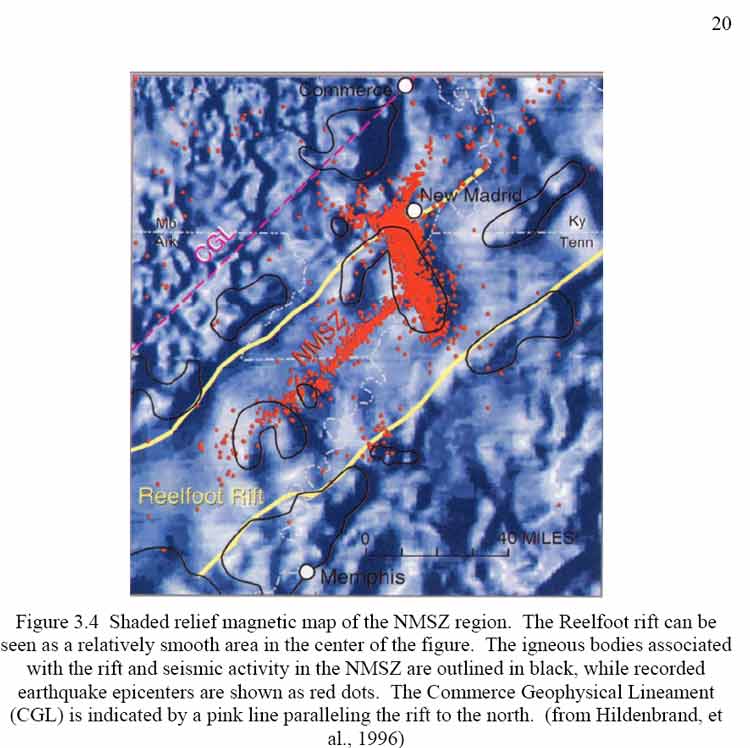
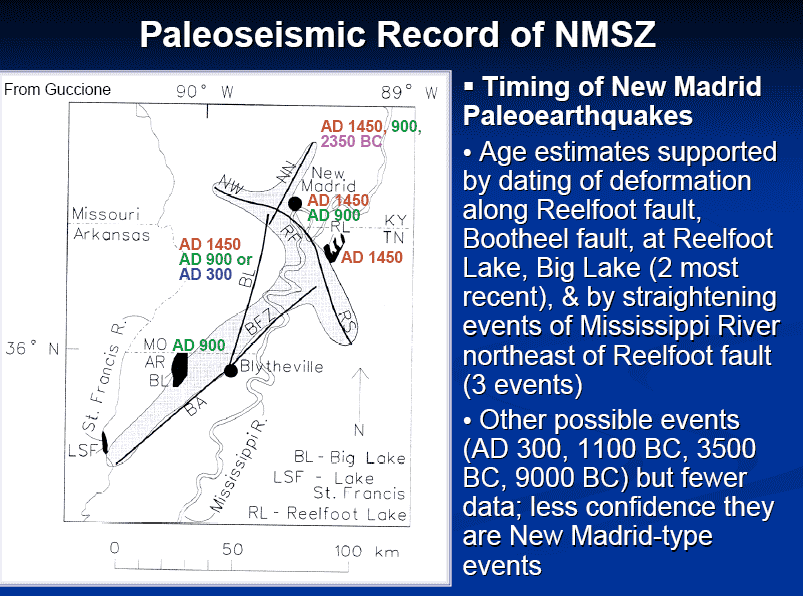
Radiocarbon dating of wood in the remains of ancient seismic features, including old sand blowouts, suggest that significant earthquakes occurred in the New Madrid system between 780 and 1000 AD, 1180 and 1650 AD, and 4,000 to 5,000 years ago. Magnetic measurements and studies of seismic waves that pass through the subsurface bedrock of the region indicate that the rocks around the New Madrid system have not been overly deformed over the past 300 million years.

Like other rift zones, the Reelfoot Rift is a sunken linear valley bounded by normal faults. The normal faults run southwest-northeast. The rift formed about 600 million years ago, but spreading stopped before the North American plate could be broken in two. Tectonic activity restarted in the rift zone about 100 million years ago during the age of the dinosaurs. Lava erupted out of the normal faults, perhaps from a hotspot that now exists near Bermuda. Currently, we don't know if the periodic earthquakes in the New Madrid fault system are related to a slow reactivation of the Reelfoot Rift zone or not.

Reference books: Hyndman and Hyndman, Sieh and LeVay

above credit David Rodgers, UM Rolla
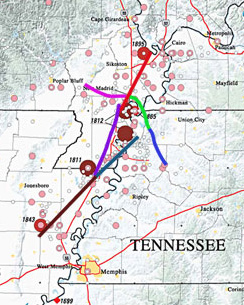
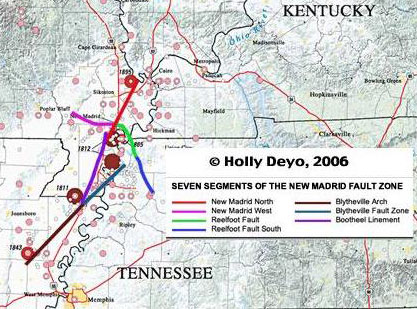
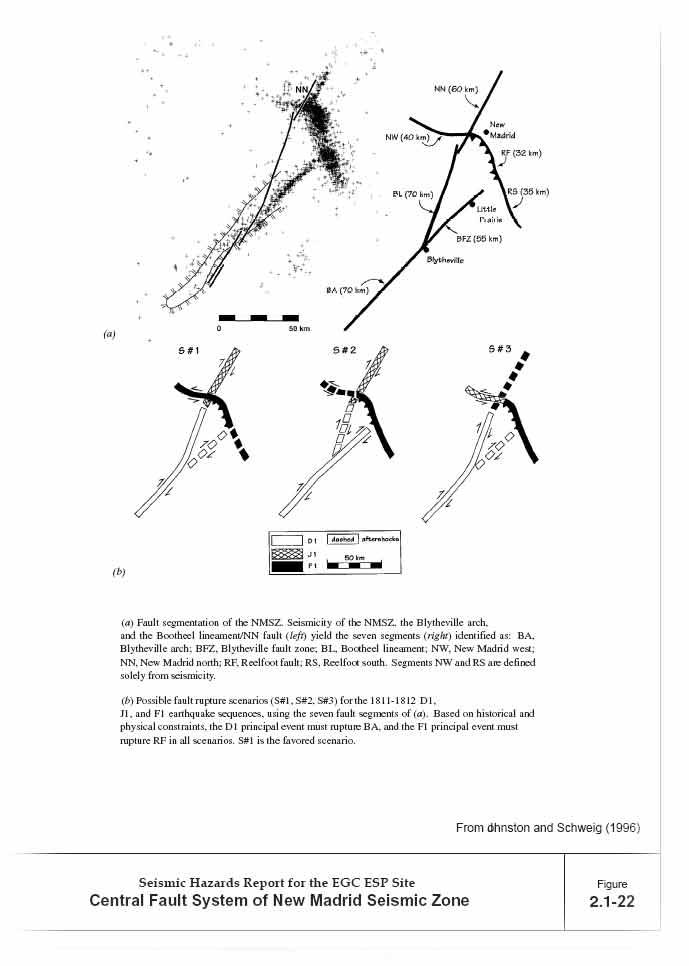


Bootheel lineament - fault

The Bootheel Lineament was termed a "fault" in 2003 after scientists dug and found displacement they had suspected. Click the illustration above for the story.

New Madrid Fault quakes, movement
(above):  Earthquake epicenters in the NMSZ and surrounding regions  projected onto a topographic base map. 
Modern earthquake data (for events M>2 since 1974, dark blue dots) are from the NEIC and CERI Catalog (1974-2003); 
pre-1974 and historic earthquake data (M>5, red dots) are from Stover and Coffman [1993]. 
Yellow dots: large 1811-1812 events [Stover and Coffman, 1993].

Quakes since 1812


GPS movement in NM fault 1991-97

Coulomb stress change on seismicity New Madrid
Above: Some researchers focus on coulomb stress change and say there is a greater chance of quakes just outside the New Madrid Seismic zone than inside it.
US Seismicity 1973-2003

US earthquakes

U Ky - plutons & New Madrid Fault

Description Magnitude Frequency per year
Great 8.0+ 1
Major 7.0-7.9 18
Large (destructive) 6.0-6.9 120
Moderate (damaging) 5.0-5.9 1,000
Minor (damage slight) 4.0-4.0 6,000
Generally felt 3.0-3.9 49,000
Potentially perceptible 2.0-2.9 300,000
Imperceptible less than 2.0 600,000+

From Earthquakes and the Urban Environment, Vol. 1, G. Lennis Berlin, 1980

How Many Earthquakes Happen Every Month? Day? Minute?

Using the previous table:

Per month..........................................Approximately 80,000

Per day.........................................Approximately 2,600

Per minute..................................Approximately 2

from CERI - Memphis


Map pages 1 | 2 | 3 | 4 | 5 | 6 | 7 | aerials | sitemap


Powered by Show-Me.net